

Making a Science Fiction Game Map: How I Build a Galactic Sector Map for TTRPGs
This article is based on my own walk-through and map-making process for a science fiction tabletop RPG map. I explain the choices I made, the tools I used, and a step-by-step method you can follow to produce a visually striking, mechanically useful sector map that your players can use as a player-facing handout. If you enjoyed the original video where I demonstrate the process, you'll recognize the examples and the finished map throughout this post.
Space. The final frontier.
I wanted to make a map that sits between two extremes that many sci‑fi games fall into: the enormous, almost abstract "galactic map" and the tiny, highly detailed "ship/planet/installation" diagram. My goal was a mid‑level galactic sector map suitable for campaigns that explore multiple star systems, trade routes, empires, and hazards — the kind of play you might see in Star Trek or the travel structure of Star Wars, but presented with clear cartographic logic so movement, distance and political control feel meaningful.
In concrete terms, the sector I mapped is roughly 15,000 light years by 10,000 light years. That’s a very large swath of space by human standards, but in a galactic sense it’s a small, useful operating theater for a campaign. Within that area I planned for around fifty points of interest (planets, inhabited planetoids, stations, anomalies) and added insets to show how the sector sits inside a spiral galaxy and how vertical depth inside the galactic disk affects positioning.
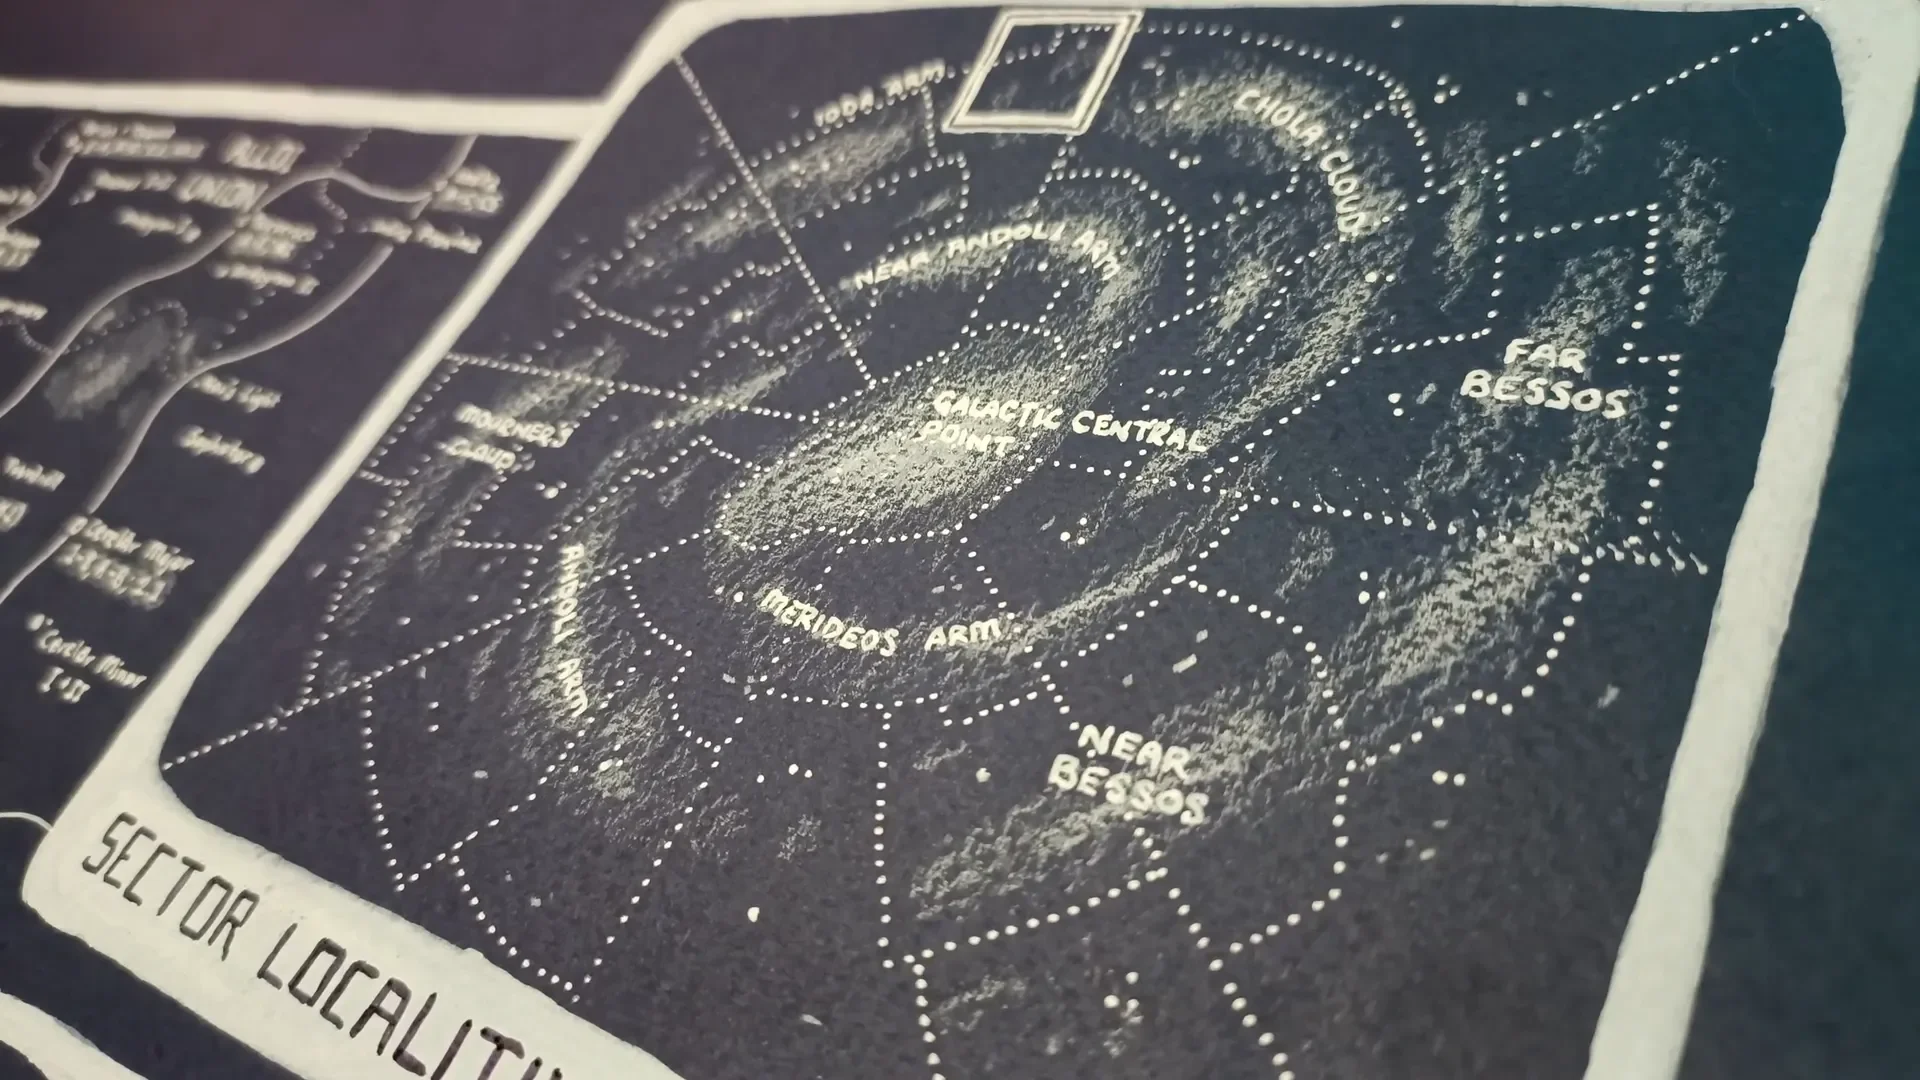
The result is a player‑facing map: visually striking, hand‑made on dark blue watercolor paper, annotated with a compact legend and a tiered alphanumeric classification system for planetary systems. Below I’ll walk you step by step through the process I used so you can reproduce or adapt it for your own game.

Step 1: Choose the Scope — Sector vs Galaxy vs Planet
Before you touch pen to paper, decide the scale you'll actually need. For TTRPG play you don't usually want to design an entire galaxy full of billions of stars — that's both unnecessary and a distraction. Instead, choose one of three working scales:
- Planet/Outpost — close‑up mechanical maps (docks, interiors, etc.).
- Sector — my chosen scale; multiple star systems, space stations, trade routes, and empire borders within a restricted area.
- Galaxy — broad political/strategic maps used for epic, empire‑level play (rarely needed at session level).
I recommend a sector if your campaign expects the group to travel between multiple solar systems and encounter varied politics and hazards but not to cross the entire galaxy in every session. A sector map gives depth to travel (literal and political) without overwhelming detail.

Step 2: Gather Materials — Tools I Used
My map is hand‑made on a dark blue sheet of 180gsm watercolor paper. I worked primarily in white media to get strong contrast and a retro‑terminal look, and finished with some black ink highlights. The specific tools I used:
- Dark blue 180gsm watercolor paper (makes white media pop).
- White acrylic pens (for crisp stars and lines).
- White correction (white‑out) pens like Uni Posca for broader strokes.
- White colored pencil (for nebula texture and soft shading).
- Black ink pen (sparingly, for small labels and final accents).
If you prefer digital work, you can reproduce the same layers (background, points, nebulae, insets) on separate layers. However, I find that making it by hand helps me invent better details as I draw.

Step 3: Plan Insets — Show Location, Depth, and Orientation
Because galaxies are three‑dimensional discs, a good sector map needs quick visual cues to help players understand where things are—not only in lat/long across the plane, but vertically within the disc. I used three insets on the right side of my map:
- A galactic inset showing a spiral galaxy with the sector highlighted — this gives context to the players about how far from the galactic core they are.
- A top‑down grid inset showing latitude and longitude within the sector (helps you coordinate encounters and movement).
- A depth profile (the vertical slice through the disk) showing how “thick” the galaxy is locally and where systems lie in z‑axis terms.
These insets serve two purposes: they make your map feel like part of a larger computer console, and they remind players that space is 3D. Two systems might look adjacent on the map but be thousands of light years apart vertically — a detail you can use in the plot or to justify travel times.

Step 4: Define Symbols — Stars, Planets, Stations, and Anomalies
Design a simple, readable set of symbols. I kept to white shapes to maintain visual coherence on dark paper:
- Star/planet systems — dots of varying size to indicate stellar prominence or system importance. I used hollow dots for systems with significant habitation/infrastructure.
- Triangles — space stations or waystations not directly tied to a major planet. Useful for indicating hubs of trade or resupply.
- Pulsars — small radiating symbols that function as navigational beacons.
- Black hole — a heavy spiral/void symbol to mark hazardous or pirate‑infested areas.
- Nebulae — white pencil shading to provide topography and visual interest without affecting mechanics.
These simple shapes let players scan the map quickly. You’ll want a legend explaining each symbol so new players are not confused.

Step 5: Create an Alphanumeric System for Planetary Classification
Stars are plentiful; you can’t label them all. What you can do is prioritize and classify the systems that matter. I developed an alphanumeric notation to communicate three things at a glance:
- How many major planets (Mars‑size or larger) a system contains.
- How many smaller planetoids (Pluto/Europa sized) exist.
- Which bodies are inhabited, the level of their civilization, and their population tier.
Format (compact): Pp - X.Y[z] where:
- P (1–6) = number of Mars‑sized or bigger planets in the system.
- p (A/B) = number of smaller planetoid bodies (A = one, B = two, etc.).
- X = index (1–6) of the planet from the star that has notable civilization.
- .Y = civilization level ranking (1 = highest technologically advanced, up to 5 = small settlement; 5 correlates roughly with ≈5 million inhabitants, a population tier that “flies under the radar” in a sector map).
- [z] = optional overall population class letter (a = large ~1 billion, b = medium, c = small, etc.).
Example: Photodiaskan system (as I used in my map):
- Notation: 6B - 4.2a
- Interpretation: Six major planets, two smaller planetoids; the 4th planet from the star hosts a level‑2 civilization (mid‑to‑advanced), and the 'a' population class indicates the largest population tier (roughly on the order of hundreds of millions to ~1 billion).
The decimal portion tells you which planet is inhabited and at what civ tier; the trailing letter is a rough population bracket. A city‑level settlement that only has about five million people will be encoded as civ rank 5, and is essentially a "detail you can add while running an adventure," rather than a major hub that needs to be on the sector map as a focal point.
This system allows you to display roughly fifty systems on a sector map and still convey which ones are the major hubs (trade centers, capital planets), which ones are colonies or mining outposts, and which are mostly barren.

Step 6: Place Your Points of Interest — Prioritize and Filter
With your symbols and classification system in hand, it's time to decide where the ~50 points will be. Remember:
- Most stars are uninhabited; only include systems that have at least one thing worth noting (population, resources, station, hazard).
- Distribute hubs along plausible trade routes — they should connect in a web, not a grid.
- Leave "no‑man's" regions with sparse points where pirates, smugglers, and mysterious ruins can hide.
- Place hazards (black hole, pulsars, dense nebulae) where they make geographic sense and provide plot hooks.
Design tip: aim for a hierarchy — a small number of large hubs (capitals, capital‑class cities), a moderate number of mid‑level worlds (mining, agriculture, refuelling), and a larger number of tiny outposts or colonies (level‑4/5 settlements). This matches how trade and politics usually distribute across space: a few nodes concentrate most traffic, the rest exist to feed or extract resources.
Step 7: Add Political Boundaries and Security Zones
Space politics rarely follow nice neat borders, but it's useful to give players a sense of who controls what. Because this is three‑dimensional space, borders should be thought of as volumes rather than lines. On a 2D map, I render them as translucent bands or contour lines that encompass the systems under a state or faction's influence.
On my map I included:
- Several empires/unions — rendered as broad sectors with jagged "gerrymandered" edges to show contested space.
- A "Free Planets" region — unaffiliated worlds acting as a pirate haven and trade skirt.
- Security zones surrounding high‑value systems (e.g., military outposts, minefields) — these are narrower bands or rings around specific systems.
These boundaries help the GM and players quickly decide where tensions might lie, where a ship will likely be boarded for inspections, or where travel insurance rates are sky high.

Step 8: Draw Trade Routes and Waystations
Trade routes are the arteries of a sector. They determine where ships go, where patrols board, and which stations thrive. My map uses thin glazed lines for the major lanes and triangular stations at key junctions. Consider these design rules:
- Connect major hubs with direct lanes when travel technology allows — these are high‑traffic and well‑served.
- Secondary lanes branch off to mining planets and small outposts.
- Waystations (triangles) are located at trade junctions, fuel stops, or "safe pockets" in hazardous regions like nebulae.
- Some lanes can be dangerous or uncharted — denote them with dashed or broken lines to indicate irregular or risky paths.
Mechanically, trade lanes can be used by you as a GM to control encounter frequency, travel times, and access to resources. When the PCs need repairs, they go to the nearest triangle station; when they want to avoid authorities, they attempt the dashed "smuggler lanes."

Step 9: Add Anomalies and Navigational Beacons
Pulsars, quasars, and other natural beacons make great both map features and GM tools. Pulsars as navigational markers are perfect for giving PCs a way to plot courses through the dark. I also added a black hole for atmosphere and as a plausible reason for an otherwise empty region.
Why include anomalies?
- They create natural barriers or shortcuts (depending on your tech rules).
- They provide plot hooks: research stations, crashed ships, pirate bases in the shadow of a black hole.
- They act as long‑term points of interest for quests and factions.

Step 10: Texture with Nebulae and Visual Topography
When the point symbols and orange‑white labels are placed, the map can look sparse. I use a white pencil to add nebula clouds and soft "topography" to suggest regions of visual complexity without altering gameplay. Nebulae can have effects if you want (e.g., communications interference, sensor dampening), but they can also be purely aesthetic.
Think of nebulae like hills on a fantasy map: they give the eye something to follow and make the map feel less sterile. They also help to visually separate factions and zones — a nebular veil makes a border feel more defensible or mysterious.

Step 11: Finalize Labels, Legend, and Readability
Labeling is crucial. Decide on a naming convention for systems (thematic names, numbered designations, or both) and label hubs prominently. Keep secondary systems lighter and use italic or smaller fonts for unimportant outposts. Your legend should include:
- Symbol key (dots, hollow dots, triangles, pulsars, black holes).
- Alphanumeric classification key (explain P/p and decimal civ tiers).
- Scale and sector coordinates (so players have a sense of travel distances).
Important: This is a player map, not your GM secret map. Give players enough detail to make meaningful decisions — where to repair, where not to stall, who controls the nearest lane — but keep individual encounter details and secret locations to your own notes if you want to preserve mystery.
Step 12: Decide Digital vs. Handmade and Layering Options
I made my map by hand and enjoy the tactile process. That said, a digital workflow offers many advantages like separate layers for depth, toggling political overlays, or showing/hiding hidden systems. Here are the tradeoffs:
- Handmade: unique texture, immediate creativity, and a satisfying final object. Great for a single printed player handout and to inspire ideas.
- Digital: flexible layers, easy edits, scalable sizes, and simple export for virtual tabletops. Ideal if you expect to iterate or produce a campaign map pack.
If you go digital, create layers for:
- Background (star field, nebulosity)
- Points/systems
- Political overlays
- Trade routes
- Annotations and legends

Sample Legend (copy and adapt)
Below is a compact legend you can paste into your map image or recreate by hand:
- Dot sizes — relative stellar/system importance
- Hollow dot — inhabited system with infrastructure
- Triangle — space station/waystation (resupply/repairs)
- Radiant star — pulsar (navigational beacon)
- Swirl — black hole (hazard/pirate lair)
- Lines — major trade lanes (solid), secondary or risky lanes (dashed)
- Region bands — political control / security zones
- Alphanumeric — Pp - X.Y[z] (planets, planetoids, planet index, civ rank, population class)
Advanced Notes: Representing Depth and Movement Mechanically
When mechanics matter, depth can't just be aesthetic. Here are several ways to encode vertical depth into play:
- Color/opacity layers — on a digital map you can tint systems to indicate depth band (e.g., blue for below the plane, red for above the plane).
- Tracing paper overlays — physically slippering separate sheets to show "altitude layers" and then stacking them to illustrate alignment.
- Coordinate system — include a Z coordinate in addition to X/Y (e.g., SX-12.34.Z‑2 = Sector X12, Y34, Depth −2), used when calculating travel or line‑of‑sight anomalies.
- Travel times — make lateral distances along lanes short, but crossing depth bands consumes more fuel or requires different jump arcs.
One simple trick I used is to include a depth bar (the vertical inset). In play, when two systems appear close on the map but lie across a large depth difference, you can use that bar to impose a time penalty or a fuel cost. This reinforces the 3D concept for players without making travel math tedious.
How to Use the Map at the Table — Practical Tips
Make the map part of your campaign rituals:
- Open sessions with a quick map check-in: where is the crew, what lanes are open, which stations are closed due to quarantine?
- Use waystations as recurring NPC hubs (shipyards, merchants, fixers). Players get familiar places to return to.
- Introduce dynamic events: a new warfront expands an empire's zone; a pulsar destabilizes a lane for several sessions; a black hole's accretion stream hides a smuggler port.
- Reward exploration with local secrets that aren’t on the map: small settlements, uncharted derelicts, ancient relics — details you add as the crew visits.
Because the map is intentionally limited (only a sector), players can build reputations and relationships with factions, and their actions meaningfully shape power in that space — far more satisfying than a billion‑star sandbox where nothing they do matters on a grand scale.

Common Problems and How I Solve Them
Problem: The map looks beautiful but is cluttered and unreadable.
Solution: Simplify. Remove secondary detail layers, increase negative space around key hubs, make the legend terse. If something isn’t used in play, remove it.
Problem: Players ask for travel times and precise distances.
Solution: Decide on a simple travel mechanic (e.g., hyperjump time = base 1 + sector distance/1000 light years) and stick to it. Use the scale bar on the map for quick checks rather than exact star‑to‑star math each session.
Problem: The map feels static; the universe is not reacting to player actions.
Solution: Track influence. Add tokens or color codes to show which faction gains influence after major events. Turn those into consequences (trade route taxes, embargoes, patrol increases).
Wrapping Up: Why I Love Sector Maps
Maps are not just pretty objects; they are tools for collaborative storytelling. A good sci‑fi sector map gives players context for travel, politics, and adventure while leaving space for mystery and improvisation. It keeps the game focused: the players know where to go, why it matters, and how their ship fits into a larger web of travel and commerce.
If you try this process, you’ll find your own preferences — whether you want a denser map full of mining nodes and resource icons, or a clean map that emphasizes political and navigational information. Start with the framework I described, then add or subtract layers as your campaign demands.
Final Checklist Before You Print or Hand Out Your Map
- Legend included (symbols, alphanumeric key, scale).
- Insets: galactic context, lat/long grid, depth profile.
- Major hubs and lanes prioritized; minor details omitted or deferred.
- Political overlays and hazard zones visible but not overwhelming.
- Player usability tested — can the group decide travel paths quickly using the map?
Parting Thoughts and Next Steps
I enjoy making hand‑crafted maps and I find that the physical process often sparks better worldbuilding ideas than a purely digital workflow. That said, the map is designed to be transferrable — scan it, digitize the layers, adapt it as your campaign evolves.
If you want to go further, next topics you can explore include:
- Resource mapping (how to symbolically represent ore, warp crystals, fuel types).
- Ship diagrams and deck plans that correspond to ports on the sector map.
- Dynamic systems where borders change over campaign arcs, perhaps visualized as time‑lapse overlays.
Happy mapping. I hope this step‑by‑step breakdown gives you the tools to create a science fiction sector map that is both visually compelling and genuinely useful at the table. Let me know what you build, and if you want a downloadable digital template or the exact alphanumeric key I used, I can post those resources.
See you in the next map — and remember: make it pretty, make it playable, and make space feel dangerous again.
Made with VideoToBlog using S11E5 Making a Science Fiction Game Map.mp4